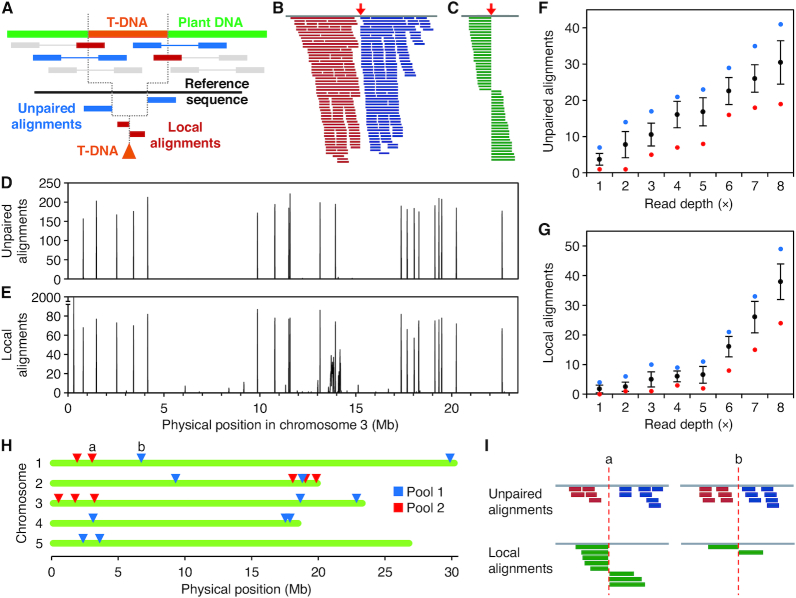
Figure 5.
Mapping T-DNA insertions with WGS paired-end reads. (A) Procedure devised to map T-DNA insertions with massive paired-end reads. Total reads are aligned to the T-DNA sequence. Pairs with only one mate aligned (blue) or clipped sequences (red) are then aligned to the genome sequence, delimiting the position of the insertion. Reads and template are not drawn to scale. (B, C) Output of the alignment of simulated reads selected for mapping to the genomic sequence. The red arrows indicate the positions of the insertions simulated. (B) Unpaired alignments from a population of paired-end reads. (C) Local alignments (30–70 bp long) from a population of 90-mer reads. (D, E) Profile of the accumulation of (D) unpaired and (E) clipped alignments from simulated reads on Arabidopsis chromosome 3. Bin size is 10 kb. (E) Note that alignments peak at the same bins as in (D). Also note that false positives appear at positions 0.3 and 13.5–14.5 Mb. (F,G) Average number of (F) unpaired and (G) local alignments per insertion at different average read depths. Black dots and bars represent mean and standard deviation, respectively. Blue and red dots represent the maximum and minimum values, respectively. n = 100 insertions. (H, I) Insertions found in two pools of SALK mutants sequenced with low (5×) read depth from an experiment described in a published work (37). (I) Read signatures from two insertions labeled as a and b in (H).

