
Figure 2.
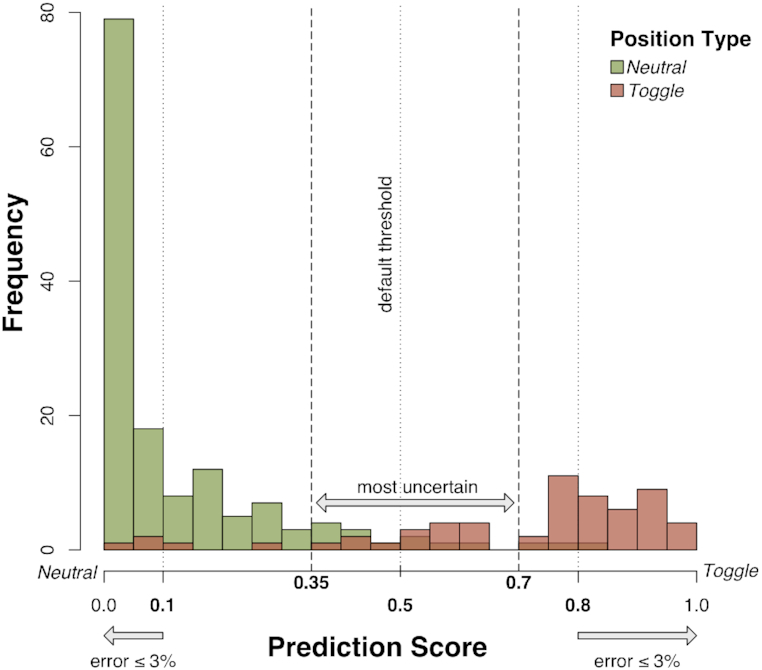
Determination of ntModel thresholds. LOO-CV predictions of the ntModel were used to determine individual position type prediction score thresholds. Positions with a Neutral label assigned in the VEL step are shown in green, those labeled as Toggle -in red. Thresholds were set at score ≤0.1 = Neutral and score ≥0.8 = Toggle, limiting the number of false positive Toggle or Neutral predictions to ≤3%. Positions with prediction scores in the range [0.35, 0.7] (containing 50% of all incorrect predictions of the ntModel) were defined as Rheostats.