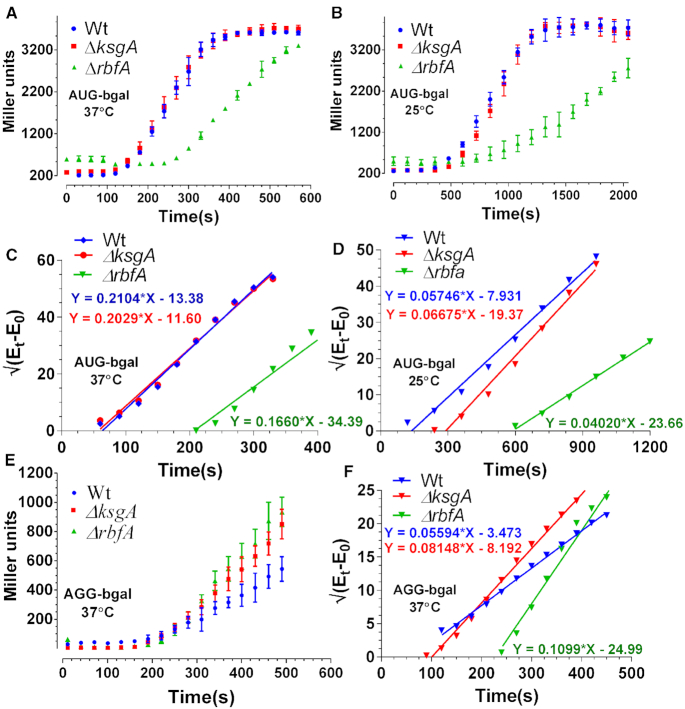
Figure 2.
Translation kinetics of premature ribosomes. (A and B) Translation kinetics of bgal production with AUG start codon in Wt, ΔrbfA and ΔksgA. Protein production kinetics was performed at 37°C (A) and 25°C (B), respectively. The plots were drawn as the averaged measurement from three independent time course experiments. The error bars represent the standard deviation of the three independent trials. (C and D) Schleif plot for bgal translation kinetics derived by plotting the square root of residual bgal enzyme activity against time from data in (A) and (B) (vide Materials and Methods). The plotted data were fitted to a linear regression model. Equations representing the trend line for each plot have been shown. The slope of the line indicates the rate of translation initiation and the X-intercept marks the first appearance of the enzyme activity that can be further used to calculate the rate of peptide chain elongation. (E) Translation kinetics of bgal production with AGG start codon in Wt, ΔrbfA and ΔksgA. The kinetics was performed at 37°C. (F) Schleif plot for bgal translation kinetics with AGG start codon derived from the data in (E).

