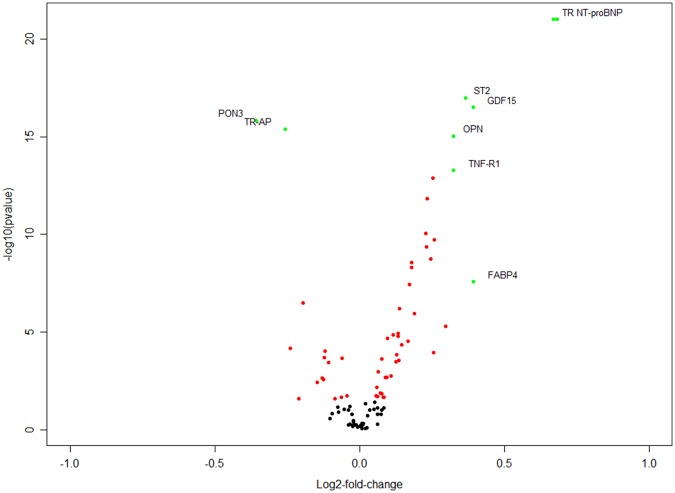
Figure 2.
Biomarker expression profile (volcano plot) in iron-deficient heart failure patients compared to patients without iron deficiency. The volcano plot shows the difference in cardiovascular biomarker expression in patients with and without iron deficiency. Each dot represents one of the 92 biomarkers of the Olink Cardiovascular III panel. On the x-axis, the log2-fold change in biomarker expression is depicted (positive log2-fold change is higher biomarker expression in patients with iron deficiency; negative log2-fold change is lower biomarker expression in patients with iron deficiency), while the y-axis shows the magnitude of the biomarker expression difference as −log10 of the P-value. Red dots are biomarkers with a significant up- or down-regulation in patients with iron deficiency (corrected for a false discovery rate of 5%); green dots indicate biomarkers with an absolute log2-fold change of >0.25. Most biomarkers were significantly up-regulated in patients with ID (n = 39, 42.4%), while 15 biomarkers had significantly lower expression (16.3%). FABP4, fatty acid binding protein 4; GDF15, growth differentiation factor 15; NT-proBNP, N-terminal prohormone brain natriuretic peptide; OPN, osteopontin; PON3, paraoxonase 3; ST2, ST2 protein; TNF-R1, tumour necrosis factor receptor 1; TR, transferrin receptor protein 1; TR-AP, tartrate-resistant acid phosphatase type 5.

