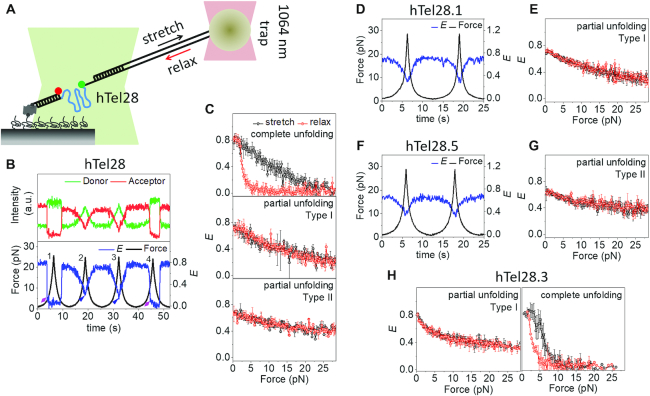
Figure 3.
Conformational dynamics of five human telomeric repeats under tension in 100 mM K+. (A) Schematic of integrated fluorescence-force spectroscopy assay: The hTel28 strand is annealed to a biotinylated strand and immobilized on a neutravidin coated quartz surface. The other end is connected to an optically trapped 1 μm diameter bead through a λ-DNA. Force was applied by translating the microscope stage at a speed of 455 nm/s. FRET was measured between Cy3 (donor) and Cy5 (acceptor) as a function of force. (B) A representative single molecule time trace of donor and acceptor intensities and corresponding E of hTel28. The fluorescence-force time trajectories were grouped into three classes based on the lowest E-value attained at a maximum applied force ∼28 pN: Complete unfolding (E ∼ 0), Type I unfolding (E ∼ 0.2) and Type II unfolding (E ∼ 0.37). Complete unfolding was observed in pulling cycles 1 and 4 (diamond-arrowheads) while cycles 2 and 3 showed Type-I unfolding (triangle-arrowheads). (C) Average E versus force response from molecules undergoing complete (N = 58, top) partial (I) (N = 150, middle) and partial (II) (N = 55, bottom) unfolding under tension. (D and F) Representative E time traces of hTel28.1 (D) and hTel28.5 (F) during two pulling cycles. (E, G and H) Average E versus force response of hTel28.1 (E), hTel28.5 (G) and hTel28.3 (H). All single molecule trajectories were collected at a time resolution of 20 ms. Error bars represent standard errors.

