
Figure 4.
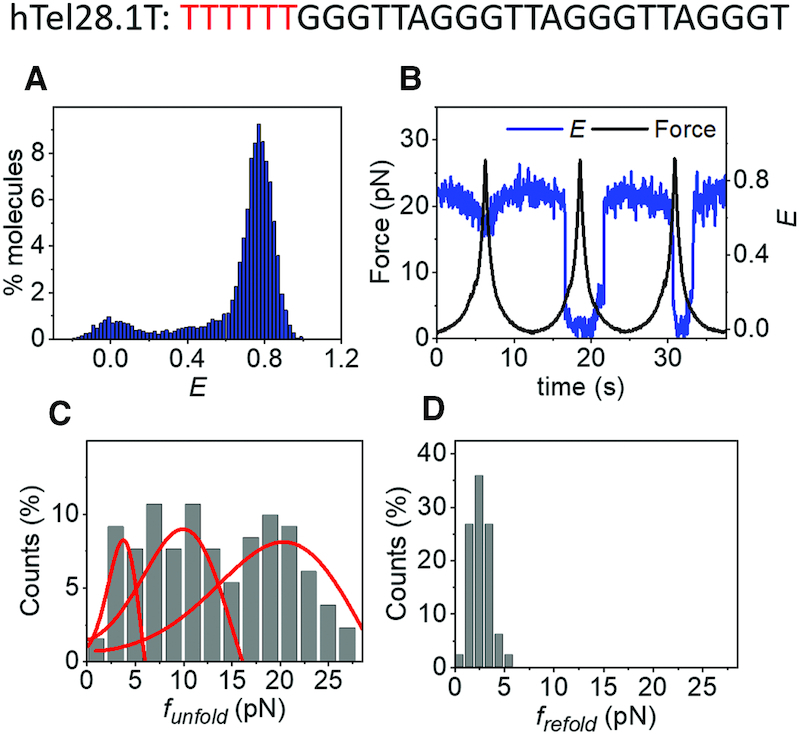
(A) E histogram of hTel28.1T in 100 mM K+, in the absence of force. (B) A representative E time trace of hTel28.1T during three pulling cycles. (C and D) Distributions of funfold (C) and frefold(D). Only those cycles showing complete unfolding were included (N = 131). The curves represent the rupture force distributions predicted using the Dudko–Szabo model (39,40).