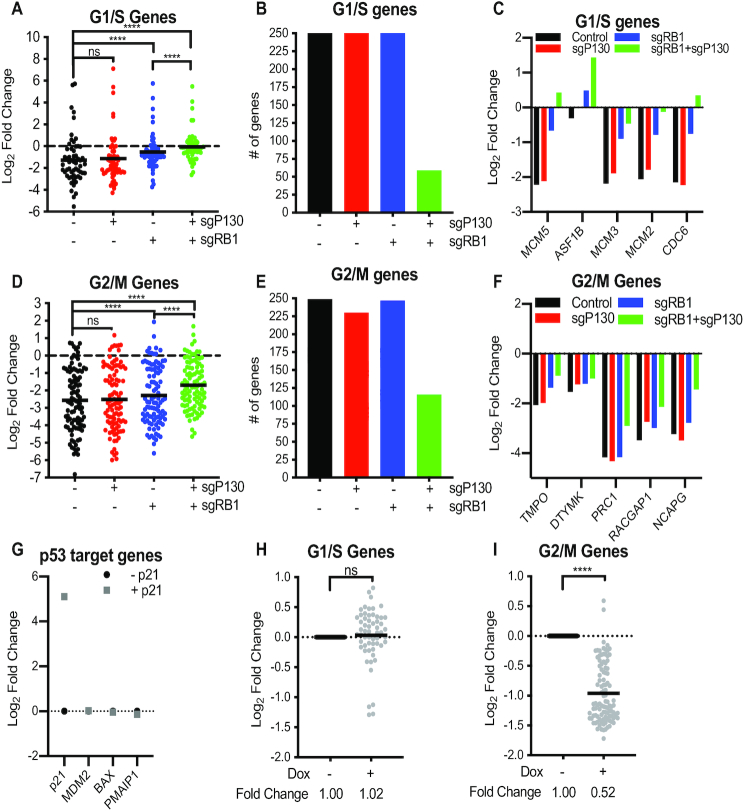
Figure 3.
G1/S and G2/M genes are differentially repressed after p53 activation when RB or p130 are lost. (A) Log2 fold change of high stringency G1/S genes measured by differential gene expression analysis comparing 0–350 nM doxorubicin treated samples for each cell line (n = 2). Statistical analysis performed using Wilcoxon matched-pairs signed rank test. (B) Number of G1/S genes differentially expressed in pairwise differential gene expression analysis. (C) Log2 fold change of G1/S genes in pairwise analysis from 3A. Gene list generated from genes with lowest adjusted P value in analysis from 1E. (D) Log2 fold change of high stringency G2/M genes measured by differential gene expression analysis comparing 0–350 nM doxorubicin treated samples for each cell line (n = 2). Statistical analysis performed using Wilcoxon matched-pairs signed rank test. (E) Number of G2/M genes differentially expressed in pairwise differential gene expression analysis. (F) Log2 fold change of G2/M genes in pairwise analysis from 3D. Gene list generated from genes with lowest adjusted P value in analysis from 1E. (G) RNA-seq of SaOS-2 cells with doxycycline inducible p21 expression (n = 3). Log2 fold change of p53 target genes. (H and I) Differential gene expression levels of high stringency G1/S (H) and G2/M (I) genes after p21 induction in SaOS-2 cells. Statistical test with Wilcoxon matched-pairs signed rank test. P values indicated as *<0.05, **<0.01, ***<0.001, ****<0.0001, NS: non significant. See also Supplemental Figures S2–S4.

