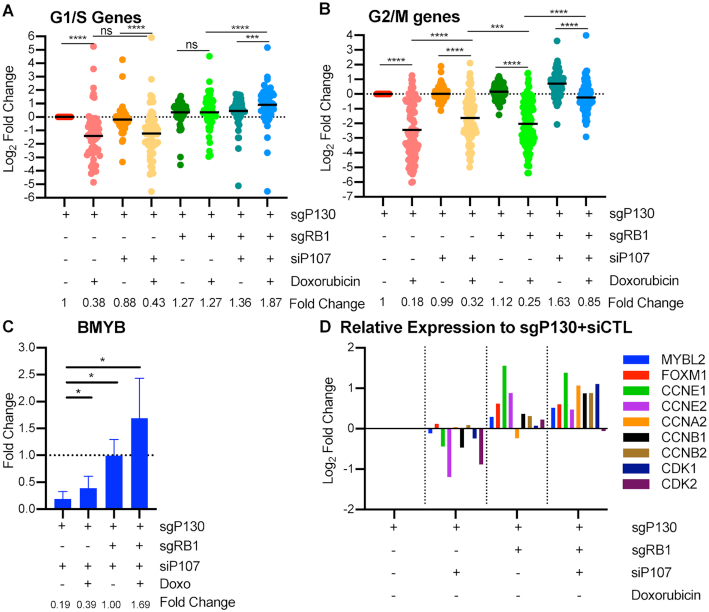
Figure 4.
p107 contributes to repression of G1/S and G2/M gene expression after p53 activation in absence of p130 or RB. (A) sgP130 or sgRB1+sgP130 HFFs were seeded at 70% density, transfected 24 h later with siRNA against p107 or Control sequence, and split from contact arrest after 48 h into doxorubicin (350 nM). Cells were collected 24 h after release and assessed by RNA-seq and differential gene expression analysis was completed compared to sgP130+siCTL untreated. Expression of high stringency G1/S genes was measured. Statistical analysis using Wilcoxon matched-pairs signed rank test between indicated samples (n = 2). (B) Same as (A) but with high stringency G2/M genes. (C) Same as (A) but transcript levels of BMYB were measured by RT-qPCR and fold change was calculated in relation to untreated for each cell type. Statistical analysis using Student's T-test between indicated samples (n = 3). (D) Relative expression of MMB-FOXM1 complex and associated genes measured compared to sgP130+siCTL untreated cells using RNA-seq. P values indicated as *<0.05, **<0.01, ***<0.001, ****<0.0001, NS: non significant. See also Supplementary Figures S5 and S6.

