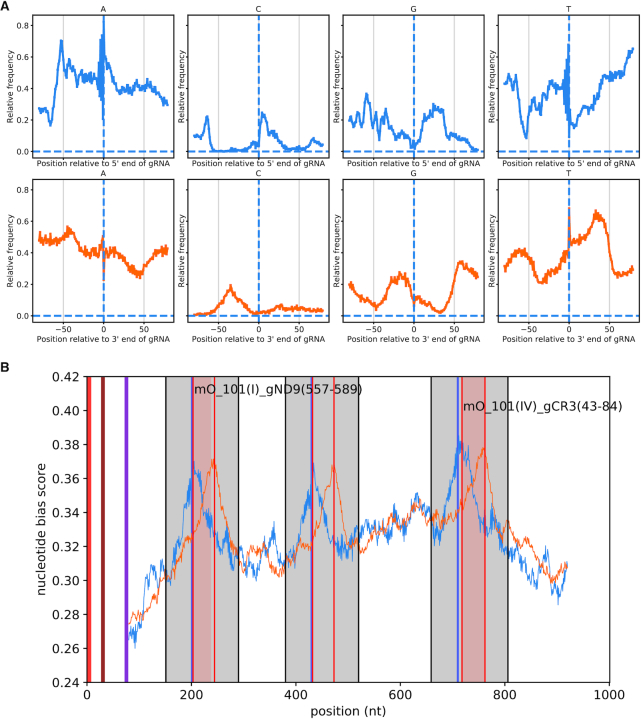
Figure 2.
Prediction of non-canonical gRNA genes by nucleotide bias. (A) Nucleotide bias of regions upstream and downstream of gRNA genes predicted by alignment to edited mRNAs. Guide RNAs were aligned at their 5′ ends. The frequency of nucleotides at each position from –80 upstream to +80 downstream of the aligned gRNA genes were obtained from the minicircles (top panels). The same procedure was carried out with the gRNA genes aligned at their 3′ ends (bottom panels). An alternative representation of this analysis is shown in Supplementary Figure S8. (B) Prediction of a non-canonical gRNA gene on minicircle 101. Grey regions: gRNA gene cassettes identified by nucleotide bias. Orange and blue curves: nucleotide bias scores of 5′ and 3′ aligned gRNAs, respectively, at each position along the minicircle. Pairs of peaks approximately 40 nt apart highlighted by thin, vertical red lines correspond to the predicted 5′ and 3′ ends of gRNAs. Red regions: gRNAs predicted by alignment of minicircles to edited mRNA. Blue vertical lines indicate RYAYA motifs. The first and the third cassette contain predicted canonical gRNAs and the second cassette a predicted non-canonical gRNA. The thick, vertical red, blue and purple lines located within the first 100 nt indicate CSB-1, CSB-2 and CSB-3, respectively.

