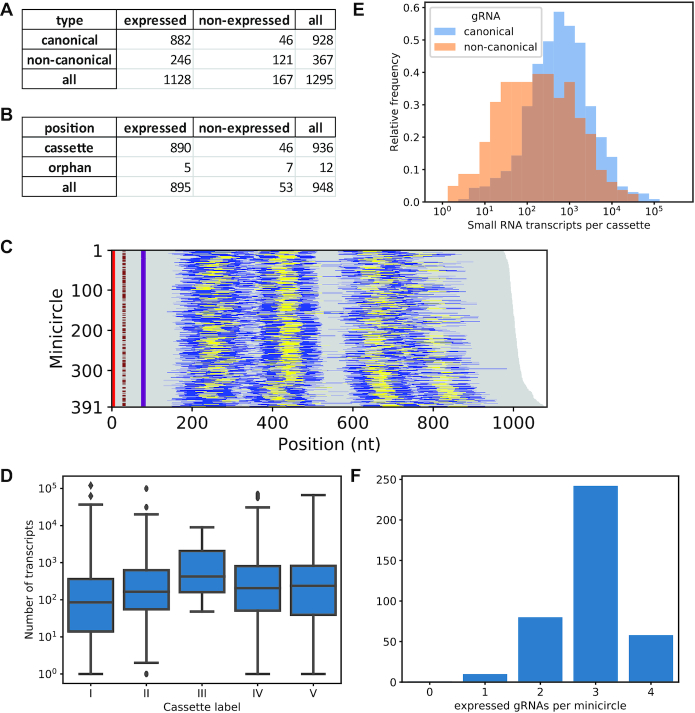
Figure 4.
Minicircle expression analysis. (A) Expression analysis of minicircle cassettes (defined by nucleotide bias and 18-bp repeats). (B) Expression analysis for canonical gRNA genes. Note that the discrepancy between the number of cassettes with expressed putative canonical gRNAs (882) and the number of expressed canonical gRNAs located in cassettes (890) arises because seven cassettes (mO_067 II, mO_164 II, mO_172 I, mO_191 I, mO_232 I, mO_243 I, mO_339 IV) encode canonical gRNAs that are potentially bifunctional, i.e. they match two distinct target mRNA sequences, and one cassette (mO_030 I) appears to encode an additional gRNA in antisense orientation. The 12 ‘orphan’ gRNA genes are located outside cassettes. (C) Guide RNA cassette position for all 391 minicircles, sorted according to size. Yellow indicates cassettes confirmed as expressed. CSB-1, CSB-2 and CSB-3 are indicated in red, brown and purple, respectively. (D) Distribution of transcript levels for the five distinct cassette locations (I–V; compare Figure 4C) within minicircles. The boxplots show the three quartile values of the distribution along with extreme values. The whiskers extend to points that lie within 1.5 interquartile ranges of the lower and upper quartile, and then observations that fall outside this range are displayed independently. There were no significant differences between positions. (E) Distributions of transcript abundances of canonical (blue) and non-canonical (orange) gRNAs (shown for replicate 2, BSF and PCF combined). Canonical gRNAs have just over four times as many transcripts on average than non-canonical gRNAs. (F) Numbers of gRNAs expressed per minicircle.

