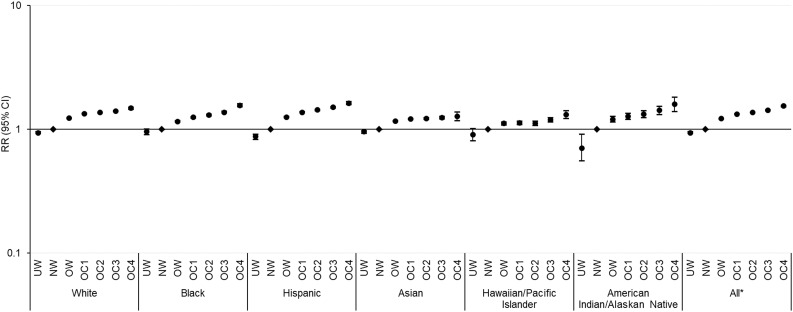
Figure 2.
Adjusted RRs (95% CIs) of prediabetes by race/ethnicity and BMI categories in a logarithmic scale. Non-Asians were categorized as underweight (UW) (BMI <18.5 kg/m2), normal weight (NW) (18.5–24.9 kg/m2), overweight (OW) (25.0–29.9 kg/m2), and obese class (OC) 1–4 (30.0–34.9, 35.0–39.9, 40.0–49.9, ≥50.0 kg/m2), and Asians were categorized as UW (<18.5 kg/m2), NW (18.5–22.9 kg/m2), OW (23.0–27.4 kg/m2), and OC 1–4 (27.5–32.4, 32.5–37.4, 37.5–47.4, ≥47.5 kg/m2). Risk estimates were adjusted for age, sex, neighborhood poverty, neighborhood education, and site. Across BMI categories, P for trend < 0.001 for all groups after FDR adjustment for multiple comparisons. *P for interaction < 0.001 between race/ethnicity and BMI categories.

