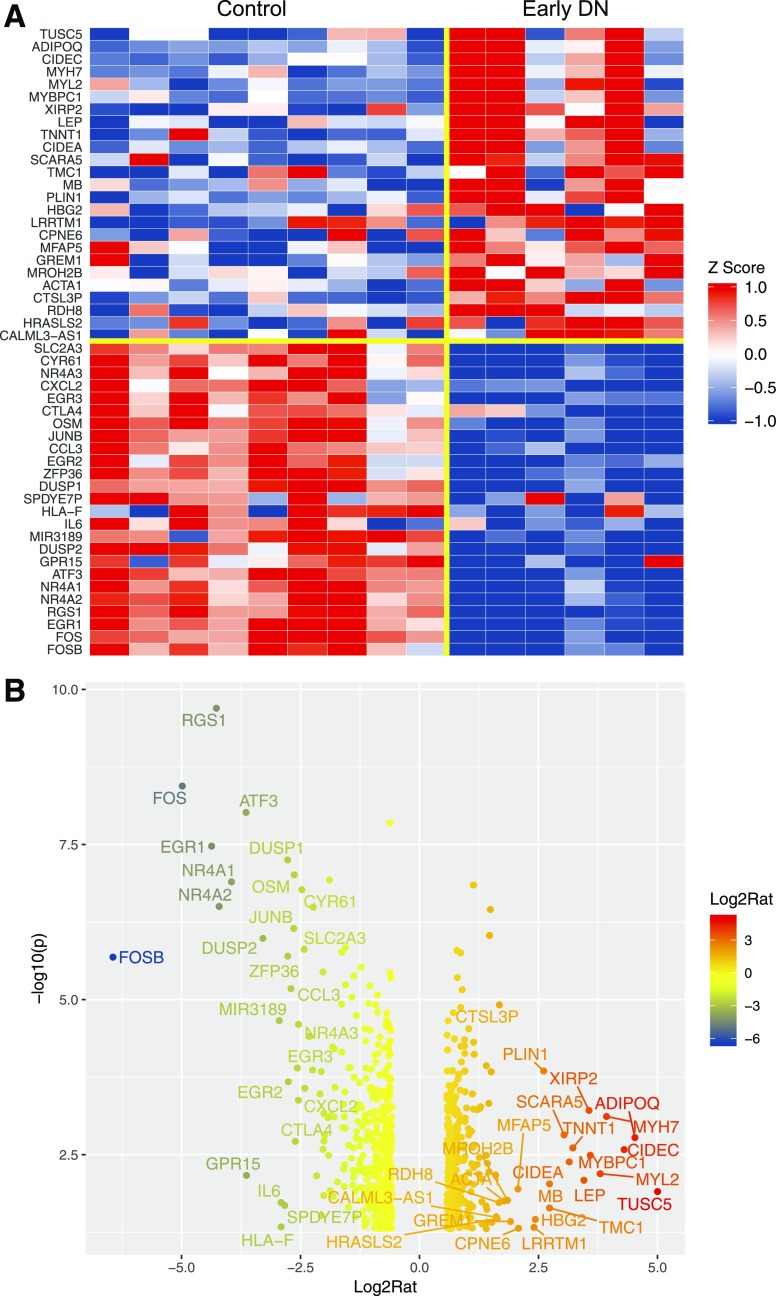
Figure 1.
Differential gene expression analysis for early DN vs. nondiabetic control. A: Heatmap of the top 50 dysregulated genes (25 upregulated genes and 25 downregulated genes) in early DN samples. Data are z normalized for heatmap visualization. Each column represents an individual sample from the control or early DN group. B: Volcano plot of dysregulated genes at limma P < 0.05 and fold change >1.5 or less than −1.5. The top 50 DEGs are labeled on the plot. Log2Rat, log2 ratio; −log10(p), −log10 P value.

