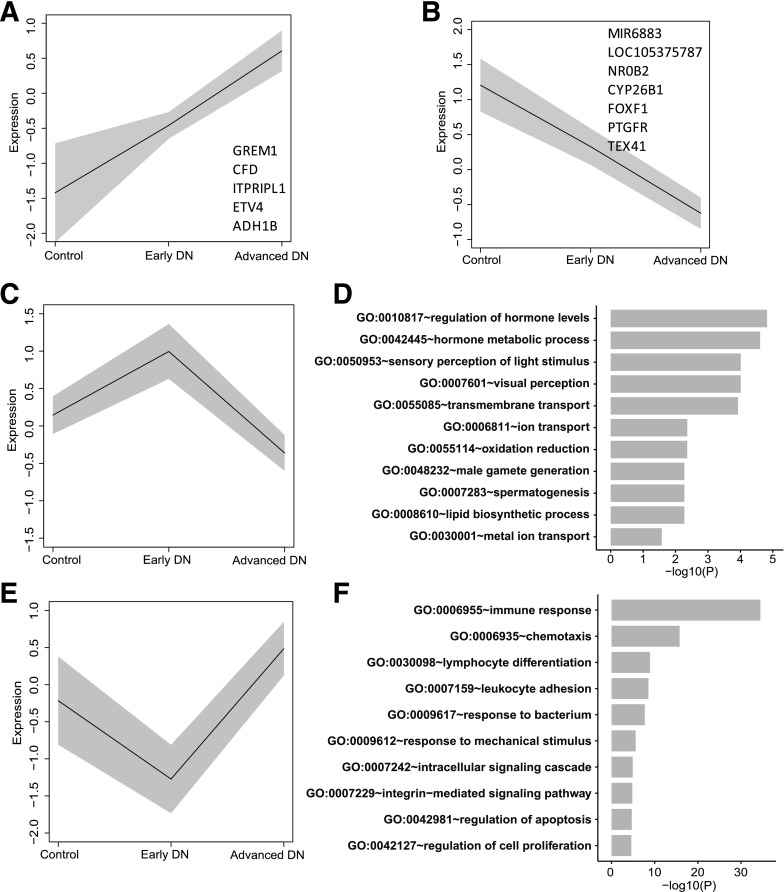
Figure 5.
Gene expression change from control to DN states. Mean expression (black line) of genes and the SD of the mean (gray band) are shown for the control, early DN, and advanced DN groups. A and B: Mean expression of five upregulated (A) and seven downregulated (B) genes. C: Mean expression of 148 genes that were upregulated in early DN but downregulated in advanced DN. D: The top 10 GO enrichment terms for 148 DEGs in panel C. E: Mean expression of 270 genes that were downregulated in early DN but upregulated in advanced DN. F: The top 10 GO enrichment terms for 270 DEGs in panel E. −log10(P), −log10 P value.

