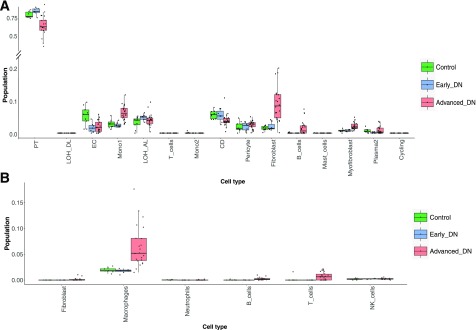
Figure 7.
Estimates of cell components by deconvolution analysis in control, early, and advanced DN samples. A: Box plots of deconvoluted cell population across all cell types estimated by Wu et al. (12). B: Box plots of deconvoluted cell population across immune cells estimated by Park et al. (13). CD, collecting duct; EC, endothelial cell; LOH_AL, loop of Henle, ascending limb; LOH_DL, loop of Henle, distal limb; Mono1, monocyte type 1; Mono2, monocyte type 2; NK, natural killer; PT, proximal tubule.

