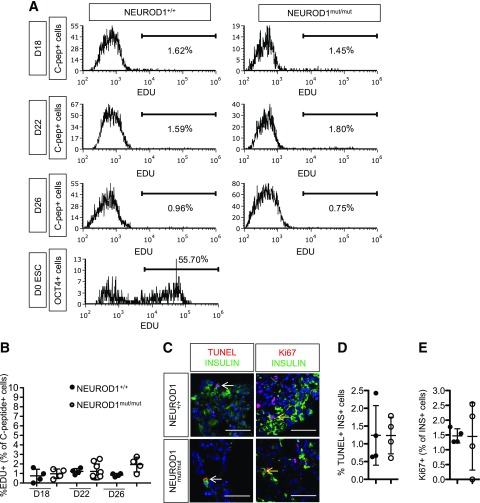
Figure 6.
NEUROD1mut/mut and control HESC-β cells have similar low rates of proliferation and apoptosis. A: Flow cytometry histograms of EDU incorporation for C-peptide+ cells at different stages of HESC-β cell differentiation as well as for OCT4+ cells in ESCs. B: Quantification of proliferating EDU+ C-peptide+ cells determined by flow cytometry analysis. C: TUNEL and IF staining for Ki67 and insulin on sections of day 27 (D27) HESC–derived endocrine clusters. Yellow arrow points to Ki67+ insulin+ cells. White arrow points to TUNEL+ INSULIN+ cell D: Quantification of apoptotic TUNEL+ INSULIN+ cells. E: Quantification of INSULIN+ cells expressing proliferation marker Ki67.

