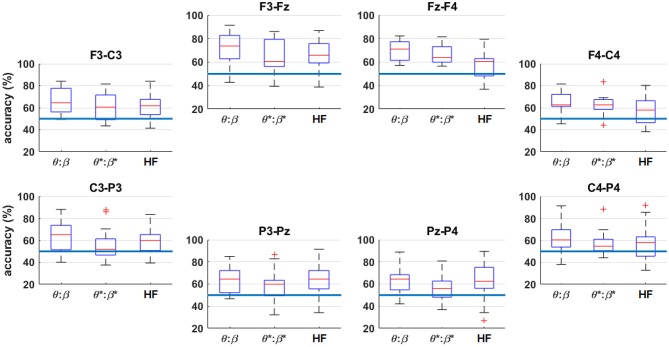
Figure 11.
Box plots of the four-fold classification accuracy across participants for n = 0 vs. n = 2, arranged by channel. The horizontal axis indicates the range of frequency bands included in the classifier. The blue horizontal lines indicate the random-chance level of classification accuracy. The asterisks (*) indicate the result after HF suppression.

