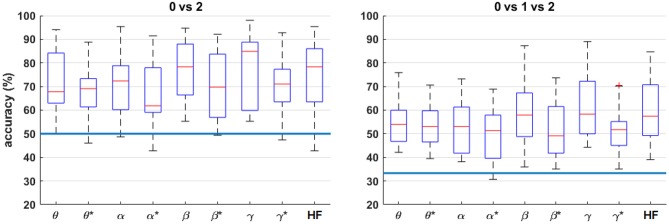
Figure 8.
Box plots of the four-fold classification accuracy across participants for each combination of workload levels. For each frequency band, all bipolar channels were included as features for the classifier. The blue horizontal lines indicate the chance level of classification accuracy. The asterisks (*) indicate the result after HF suppression.

