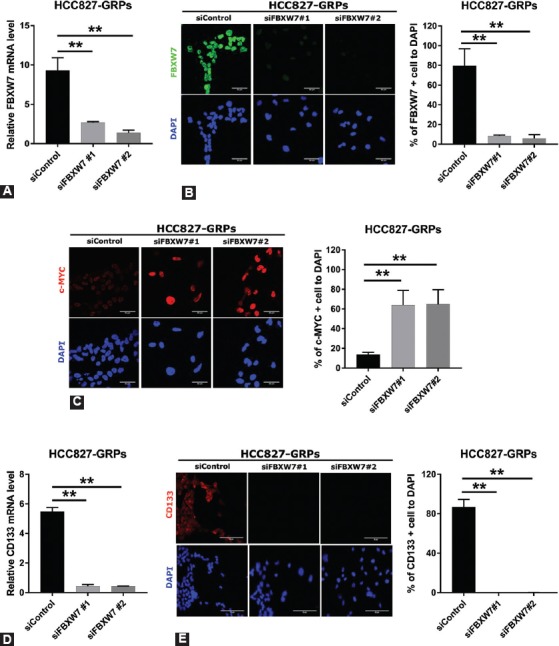
FIGURE S1.

Silencing of F-box/WD repeat-containing protein 7 (FBXW7) significantly decreased the population of CD133-positive cells and reversed c-MYC expression in HCC827 gefitinib-resistant persisters (GRPs). (A) FBXW7 expression was knocked down in HCC827 GRPs with short interfering RNA (siRNA) followed by gefitinib treatment for 72 h and examined by quantitative reverse transcription polymerase chain reaction (qRT-PCR). Two specific siRNAs and one non-specific control were used, and data representative of the siRNA experiment are shown. Average values for cells treated with the control siRNA were set to 1. Average values were calculated from triplicate experiments. Error bars, SD. **p < 0.01. (B, left) FBXW7 expression at protein level was knocked down with siRNA in HCC827-GRPs and analyzed by immunofluorescence after gefitinib treatment for 72 h. Nuclei were stained with DAPI. (C, left) c-MYC expression was analyzed by immunofluorescence after silencing of FBXW7 and gefitinib treatment for 72 h in HCC827-GRPs. Nuclei were stained with DAPI. (B, right and C, right) The ratio of FBXW7-positive cells (B, right) or c-MYC-positive cells (C, right) in HCC827 GRP cells following the silencing of FBXW7. Average values were calculated from five fields in each sample. **p < 0.01, scale bar indicates 50 µm. (D) Knockdown of FBXW7 expression with siFBXW7 followed by gefitinib treatment for 72 h in HCC827-GRPs significantly suppressed CD133 expression as determined by qRT-PCR. Average values and SDs were calculated from triplicate samples. Average values for cells treated with the control siRNA were set to 1. **p < 0.01. (E, left) HCC827 cells were cultured on Labo-Tek chamber slides and FBXW7 expression was silenced with siFBXW7, after which cells were treated with 1 µM gefitinib for 72 h. The number of CD133-positive GRPs was significantly decreased. Nuclei were stained with DAPI (blue). (E, right) The ratio of CD133-positive cells in HCC827 GRPs following FBXW7 silencing and gefitinib treatment for 72 h. Average values were calculated from five fields in each sample. **p < 0.01, scale bar indicates 50 µm.
