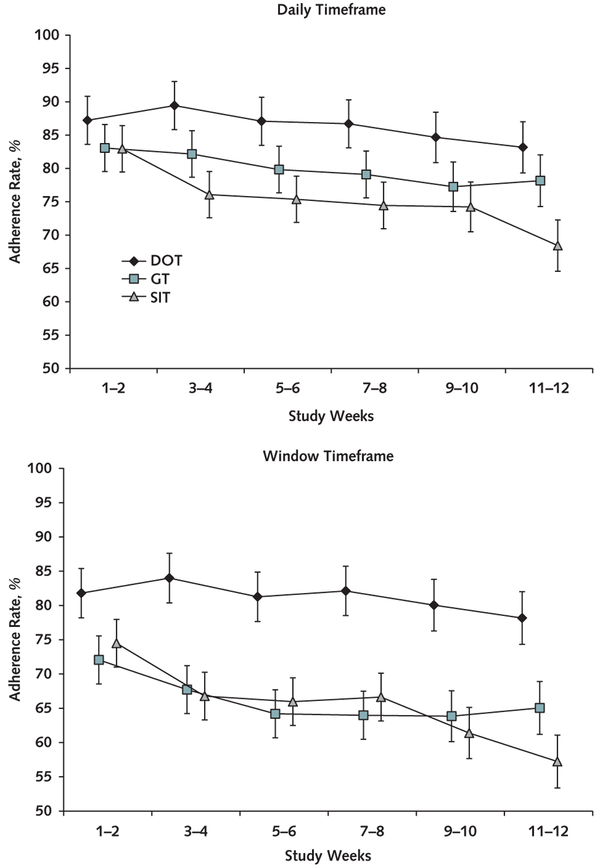
Figure 2. Adherence rates over time.
Adherence rates and their error bars are model-based estimates; SEs were obtained from the mixed-effects linear models adjusting for site and the 3 stratifying variables. Three SIT participants with no available blister pack adherence data were not included in this analysis. Error bars represent ± SEs. DOT = directly observed therapy; GT = group treatment; SIT = self-administered individual treatment.

