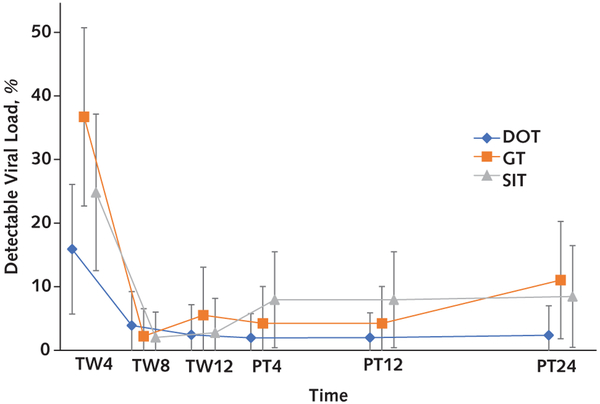
Appendix Figure 2. Percentage of detectable HCV viral loads over time.
The overall percentages of longitudinal detectable HCV viral loads during and after treatment were significantly different across the 3 groups (P = 0.021). Error bars represent 95% CIs. DOT = directly observed therapy; GT = group treatment; HCV = hepatitis C virus; PT = posttreatment week; SIT = self-administered individual treatment; TW = treatment week.

