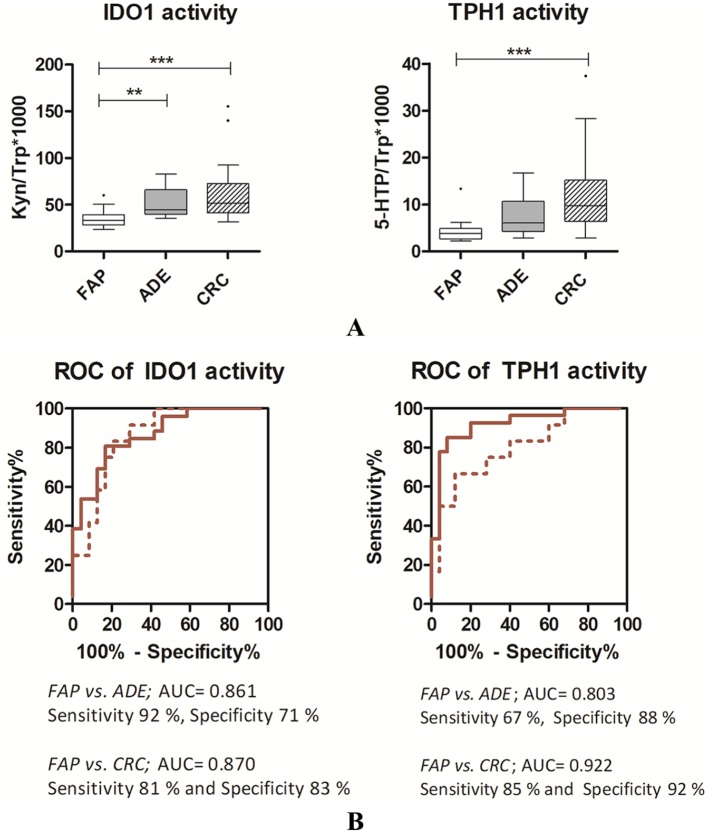
Figure 2.
(Panel A) Box plots of IDO1 and TPH1 activities. Dunn’s Multiple Comparison Test, **: P < 0.01; ***; P < 0.001. (Panel B) ROC curves for IDO1 and TPH1 activities in FAP patients with respect to ADE (dashed line) and CRC (solid line) patients.
ADE, Adenoma; CRC, colorectal cancer; FAP, Familial Adenomatous Polyposis; IDO1, indoleamine 2,3-dioxygenase 1; ROC, receiver operating characteristic; TPH1, tryptophan hydroxylase 1.

