Figure 4.
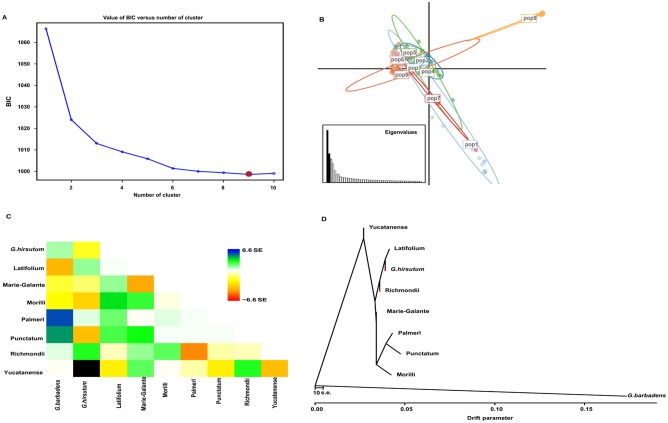
Discriminant analyses of principal components (DAPC). (A) The optimal number of clusters (K) as determined by “K-means” clustering. The graph shows an apparent decrease of the Bayesian information criterion (BIC) until K = 9, red dot, which is the most likely value of K. After this value, BIC increases. (B) Scatter plot based on the DAPC output for 4 assigned genetic clusters indicated by different colors. Dots represent different individuals. pop1 represents group 1 containing almost all races accessions; pop2 represents group 2 containing mainly Latifolium accessions; pop3 represents group 3 containing mainly Punctatum accessions; pop4 represents group 4 containing mainly Punctatum and Marie-Galante accessions; pop5 represents group 5 containing mainly Latifolium, Richmondi, and all G hirsutum cultivars; pop 6 represents group 6 containing 2 Marie-Galante, 2 Palmeri accessions, Morrilli, and Marie-Galante accessions; pop 7 represents group 7 containing 2 Yucatanense accessions; pop 8 represents group 8 containing Richmondi, Morrilli, and Marie-Galante accessions; pop9 represents group 9 which only contained G barbadense cumainly cultivars (Table S10). (C, D) Plotted is the structure of the graph inferred by TreeMix for cotton populations, allowing 10 migration events. The scale bar shows 10 times the average standard error of the entries in the sample covariance matrix.

