
Figure 1.
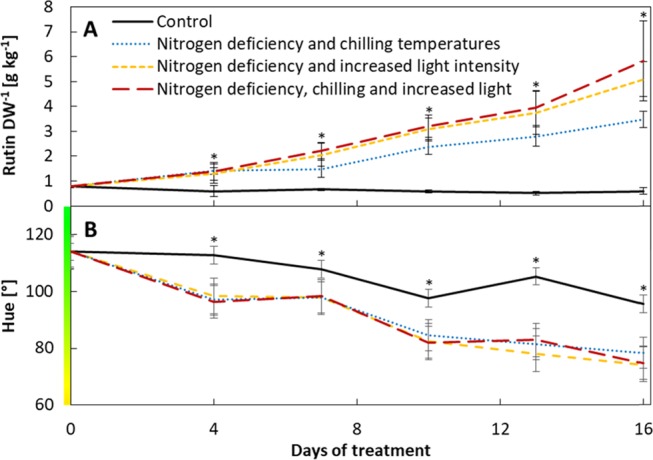
Effect of stress treatments in young tomato plants over 16 days of nitrogen deficiency in combination with increased light intensities and/or chilling temperatures compared to control plants. (a) Foliar rutin content per leaf dry weight (DW, g kg–1). (b) Leaf color assessed by smartphone image analyses (hue). Data represent the mean of N = 4 plants [±standard deviation (SD)]. Significant differences of stress to control plants [p < 0.05 using one-way-analysis of variance (ANOVA)] are indicated by asterisks.