
Figure 2.
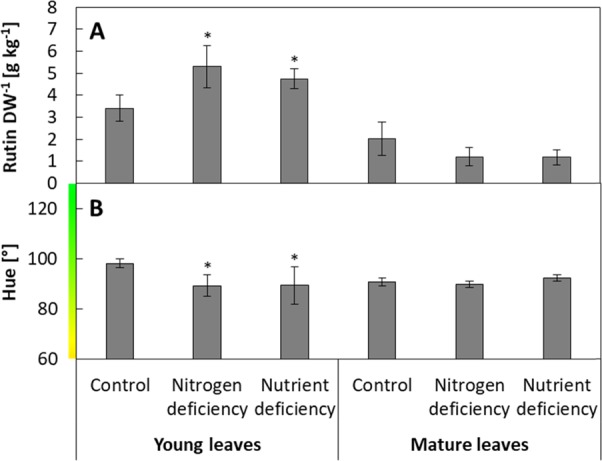
Effect of stress treatments in greenhouse-grown mature tomato plants after a 21 day stress period of nitrogen deficiency and nutrient deficiency compared with control plants. (a) Foliar rutin content per leaf dry weight (DW, g kg–1). (b) Leaf color assessed by smartphone image analyses (hue). Data represent mean of N = 5 plants (±SD). Significant differences of stressed to control plants (p < 0.05 using one-way-ANOVA) are indicated by asterisks.