
Figure 3.
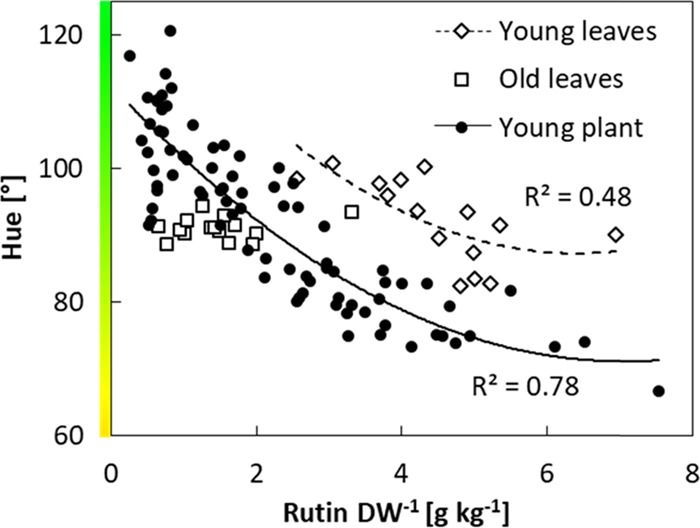
Correlation between foliar rutin content per leaf dry weight (DW, g kg–1) and leaf color assessed by smartphone image analyses (hue). Every data point represents measurements of an individual leaf sample. Trend lines represent polynomic regression fit.