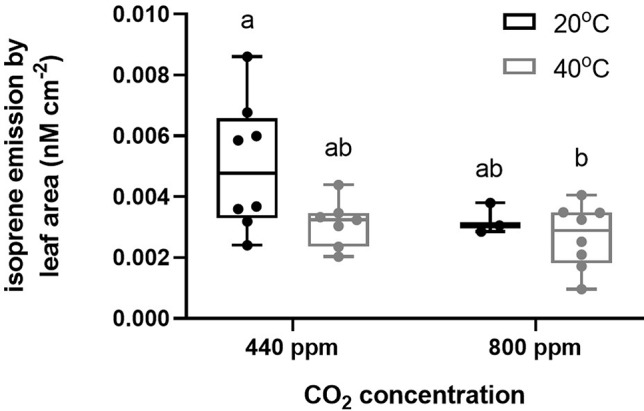
Figure 1.

Isoprene emission measurements by leaf area (nM cm−2) collected from air entrainment and analysed by GC-FID according to the CO2 and temperature treatments (Hs, eCO2, Hs* eCO2, and control). Each data point represents one entrainment collection from each plant, and each box represents each treatment. Bars represent minimum and maximum values of the isoprene emission.
