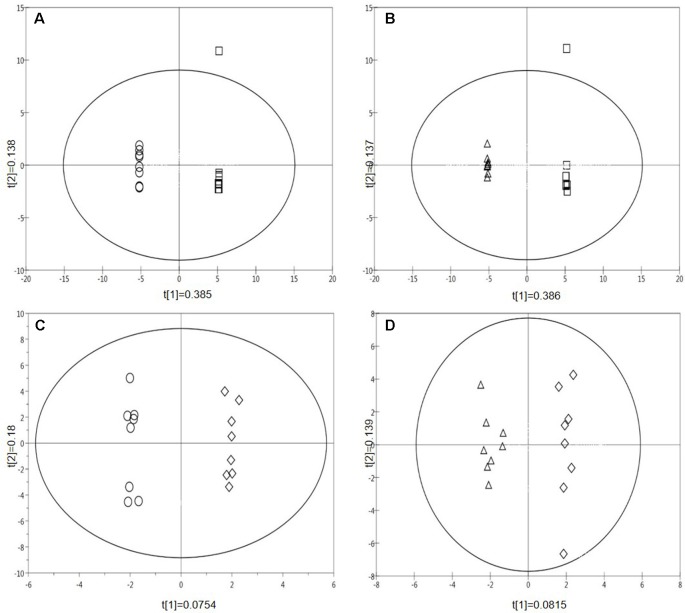
Figure 2.
Supervised multivariate OPLS-DA plots of pair-wise comparisons of the metabolite profiles of treatments for all leaf samples (Data points from MALDI-ToF analysis, polar phase, negative ionisation mode, 32 samples). (A) Hs vs. control; (B) eCO2 vs. control; (C) Hs* eCO2 vs eCO2; (D) Hs*eCO2 vs Hs. (Circle=Hs, square=control, triangle=eCO2, diamond=Hs*eCO2).

