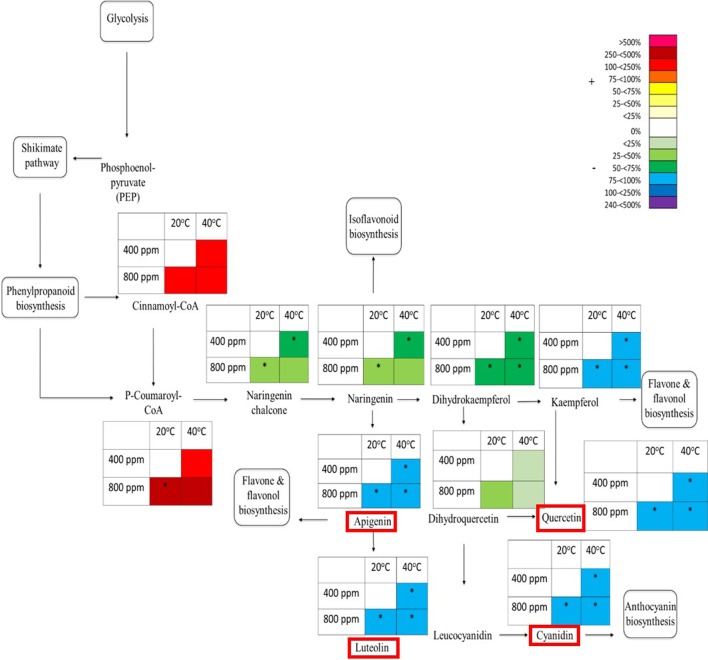
Figure 5.
Schematic pathway diagram of glycolytic, shikimate, phenylpropanoid and flavonoid biosynthesis. The tables show abundance of the metabolites calculated from the % total ion count for data from MALDI-ToF analysis (polar phase analysed in negative ionisation mode). * indicates statistically significant changes in % differences of the total ion count relative to treatment. The % bar scale shows increase or decrease in abundance of %TIC. Red boxes around specific secondary metabolites indicate identification using tandem MS against an analytical standard. Each point in the table for each metabolite represents a pooled replicate per plant across the four treatments.

