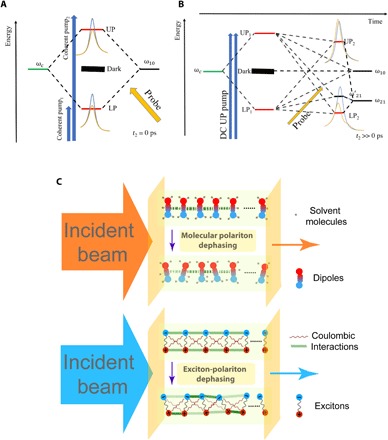
Fig. 5. Graphical representation of coherent (AC) and incoherent (DC) optical response.

(A) The energy-level diagram shows the processes giving rise to the polariton bleach and AC signal in Fig. 4, where pumping generates LP-UP coherences and thus Rabi oscillations, and polariton bleach is observed when the probe interacts with the system at a sufficiently short pump-probe waiting time (t2 < 5 ps) after pumping. Blue line shapes represent linear response signals, while yellow line shapes show the reduced transmission characteristic of the polariton bleach effect. (B) Scheme showing the DC or long-time (t2 ≫ 3 ps) pump-probe response, where polariton population is generated and subsequent decay into the dark reservoir leads to changes in the collective oscillator strength due to a reduction in the average number of molecules in the ground state. Blue line shapes represent linear response signals, while yellow line shapes give the pump-probe polariton line shapes. (C) Schematic representation of nonlinear dephasing mechanisms for dipole-active vibrational (top) and inorganic exciton-polaritons (bottom). Strong electron-hole Coulomb interactions induce fast dephasing of the Wannier-Mott excitons of inorganic exciton-polaritons. These forces tend to be much less relevant in the molecular case because the excitations (dipoles) interact weakly. Therefore, nonlinear molecular vibrational dephasing arises from inter- or intramolecular anharmonic interactions.
