
Fig. 4. Estimation of the switching rate dynamics of the SP-MC molecules from the intensity time trace of individual CNTs.
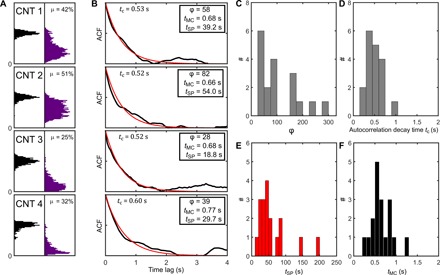
(A) Four normalized intensity histograms and the corresponding temporal ACFs (B) for the CNTs shown in Fig. 1. (C and D) The histograms of the intensity ratio φ and tc, respectively, obtained from individual carbon nanotube luminescence time traces. Knowing φ and tc, the values of tSP (E) and tMC (F) can be estimated. Values correspond to mean ± SEM.