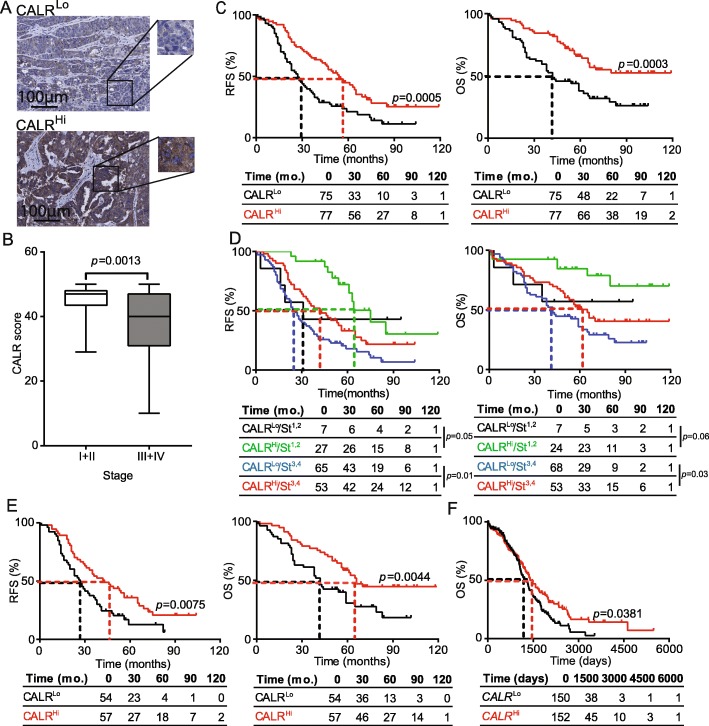
Fig. 1.
Prognostic impact of CALR expression in the primary TME of HGSC patients. a Representative images of CALR immunostaining in CALRLo and CALRHi patients. Scale bar = 100 μm. b CALR expression levels among different pathological disease stages. Box plots: lower quartile, median, upper quartile; whiskers, minimum, maximum. RFS (c) and OS (d) of 152 HGSC patients who did not receive neoadjuvant chemotherapy, upon stratification based on median CALR expression. d RFS and OS of 152 HGSC patients who did not receive neoadjuvant chemotherapy, upon stratification based on median CALR expression and stage. e RFS and OS of 111 HGSC patients stage III who did not receive neoadjuvant chemotherapy, upon stratification based on median CALR expression (f) OS of 302 HGSC patients from the TCGA public database upon stratification based on median CALR expression. Survival curves were estimated by the Kaplan-Meier method, and difference between groups were evaluated using log-rank test. Number of patients at risk are reported

