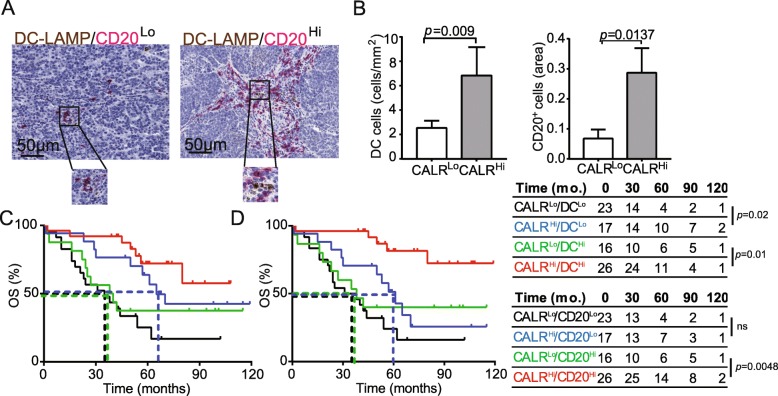
Fig. 4.
CALR expression positively correlate with the frequency of mature DC-LAMP+ DCs and CD20+ B cells. a Representative images of DC-LAMP and CD20 immunostaining. Scale bar = 50 μm. b Density of DC-LAMP+ cells and CD20+ B cells in TME of CALRLo versus CALRHi HGSCs (n = 82). Box plots: lower quartile, median, upper quartile; whiskers, minimum, maximum. OS of HGSC patients (study group 1) who did not receive neoadjuvant chemotherapy, upon stratification based on median expression of CALR and density of DC-LAMP+ cells (c) or CD20+ B cells (d)

