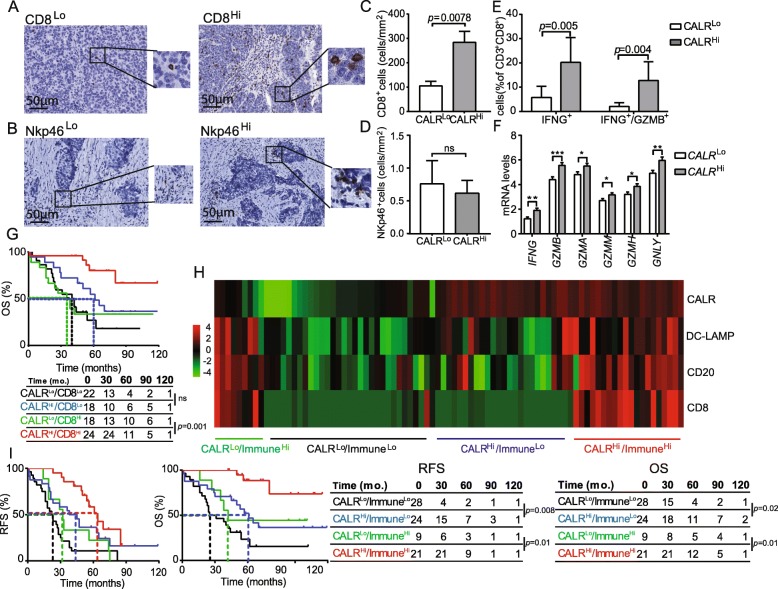
Fig. 5.
Impact of CALR on the frequency and cytotoxicity of CD8 T cells in HGSC and immune contexture of HGSC. Representative images of CD8 (a) and Nkp46 (b) immunostaining. Scale bar = 50 μm. Density of CD8+ (c) and NK (d) cells in TME of CALRLo versus CALRHi HGSCs (n = 82). Box plots: lower quartile, median, upper quartile; whiskers, minimum, maximum. e Percentage of IFN-γ+ and IFN-γ+ /GZMB+ cells among CD8+ T cells from the HGSC of 17 CALRLo and 18 CALRHi patients after non-specific stimulation. Box plots: lower quartile, median, upper quartile; whiskers, minimum, maximum. f Expression levels of IFNG, GZMB, GZMA, GZMM, GZMH, GNLY in CALRHi patients from the TCGA database as compared to their CALRLo counterparts. (302 patients were divided into 4 groups using quartile stratification, only lower (no = 77) and upper (no = 77) quartile is presented). Box plots: lower quartile, median, upper quartile; whiskers, minimum, maximum. g OS of HGSC patients (study group 1) who did not receive neoadjuvant chemotherapy, upon stratification based on median expression of CALR and density of CD8+ cells. Survival curves were estimated by the Kaplan-Meier method, and difference between groups were evaluated using log-rank test. Number of patients at risk are reported. h Clustering of HGSC patients from study group 1 based on median stratification of CALR expression and median densities of DC-LAMP+, CD8+ and CD20+ cells as determined by immunohistochemistry. i RFS and OS of HGSC patients from study group 1 who did not receive neoadjuvant chemotherapy, upon stratification based on median expression of CALR and median density of immune infiltrate as indicated by clustering heatmap. Survival curves were estimated by the Kaplan-Meier method, and differences between groups were evaluated using log-rank test. Number of patients at risk are reported

