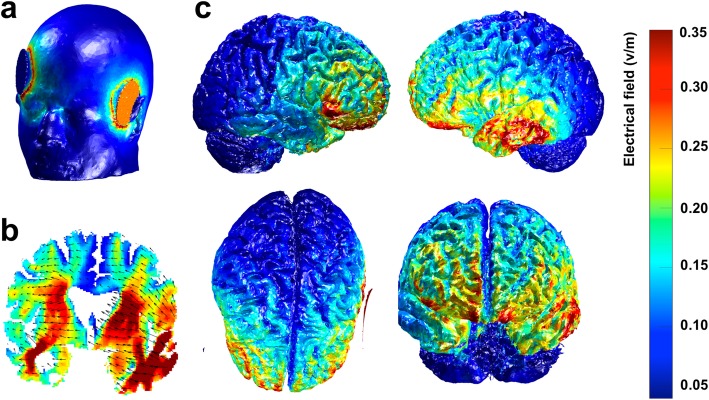
Fig. 5.
Example of a computational model produced with the open-source tool ROAST for the simulation of transcranial direct current stimulation (tDCS) current magnitude and distribution using a 3D T1-weighted image from a representative SD patient. a Illustration of the montage for the left-anodal stimulation. The round blue patch represents the cathode, placed over the right supra-orbital region [10–20 electroencephalography (EEG) coordinates AF8], and the red round patch represents the anode, placed over the left Anterior Temporal Lobe (ATL) (Montreal Neurological Institute (MNI) coordinates: x = − 52, y = 2, z = − 28). b Coronal slice view of the electric field with current flow direction represented by the black arrows. c Electric field distribution on the cortical surface - right hemisphere view, left hemisphere view, upper view and frontal view. The color-bar represents the magnitude of the electric field, in Volts per meter, in different regions of the brain (for panels b and c)

