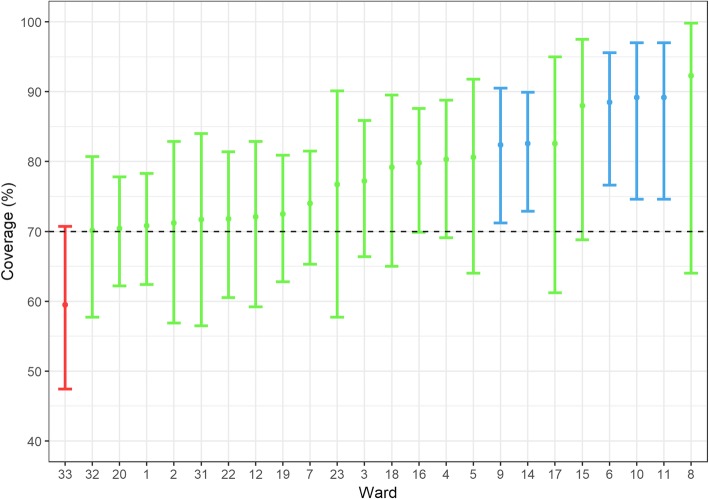
Fig. 2.
Plot of vaccination coverage achieved in each ward. The 95% Confidence Interval (CI) is represented as vertical bars. Wards in which the coverage surpassed 70% are coloured in green, while wards under 70% are coloured in red. Wards whose coverage and 95% CI lower bound surpass 70% are coloured in blue

