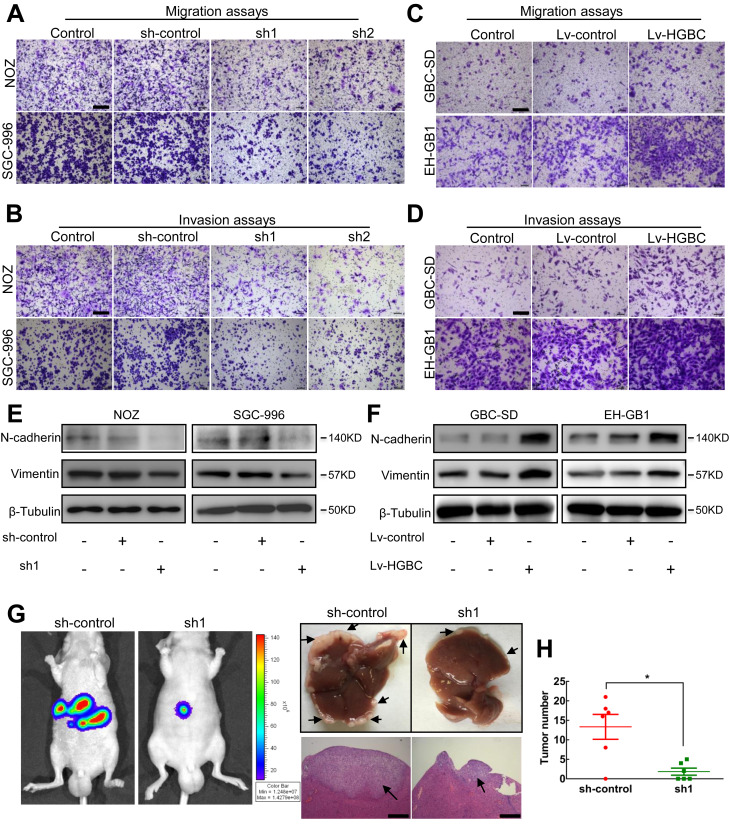
Fig. 3.
LncRNA-HGBC reinforces the invasive capacity of GBC cells. a, b Transwell assays (a) and Invasion assays (b) were used in NOZ and SGC-996 cells. Scale bars, 200 μm. c, d Transwell assays (c) and Invasion assays (d) were used in lncRNA-HGBC-overexpressing GBC-SD and EH-GB1 cells. Scale bars, 200 μm. e, f The protein levels of N-cadherin and Vimentin in control and lncRNA-HGBC-knockdown NOZ (left) or SGC-996 (right) cells, and in control and lncRNA-HGBC-overexpressing GBC-SD (left) or EH-GB1 (right) cells. g Representative images of luciferase signals in mice at the 6 weeks after intrasplenic injection with NOZ cell clones (left). Representative livers were shown and the isolated liver tissues sections were stained by hematoxylin and eosin (righ). Arrows indicate the metastasis nodules. Scale bars, 500 μm. h The average number of liver metastases in the intrasplenic injection model. Data are presented as mean ± SD of three independent experiments. *P < 0.05, **P < 0.01, ***P < 0.001

