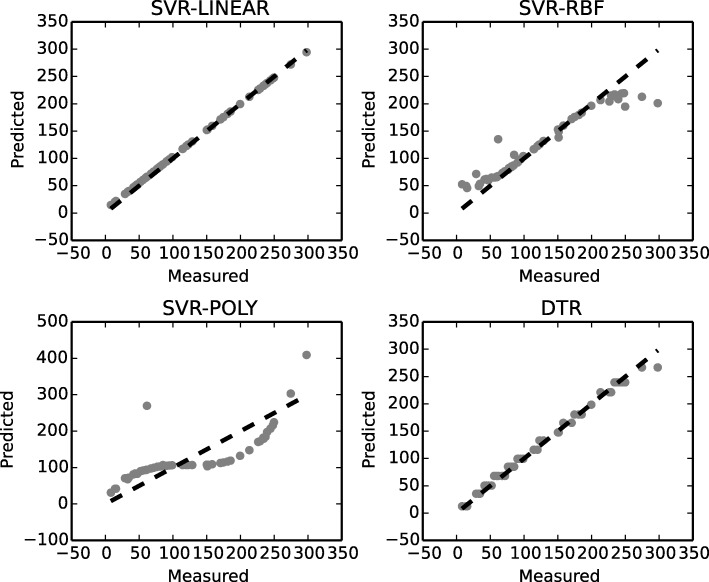
Fig. 6.
Success rates of machine learning models for survival time prediction. Predicted-to-measured values of survival time prediction (by TICF), where numbers correspond to months of survival time prediction. A dotted line symbolizes an ideal case of the ratio predicted to measured TICF for survival time prediction

