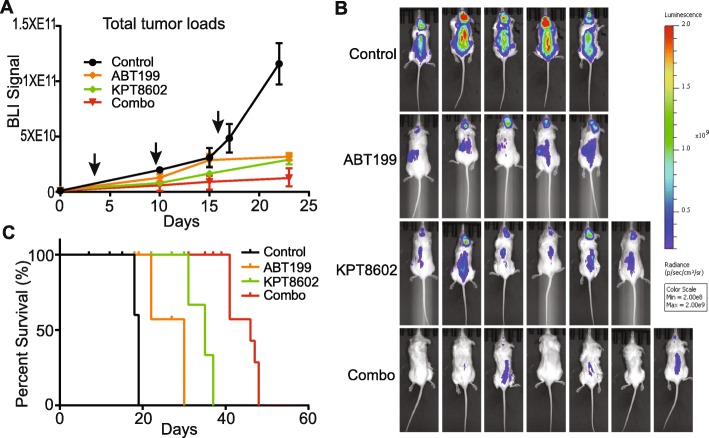
Fig. 4.
In vivo therapeutic effects of combining XPO1 and BCL2 inhibitors. a PDX tumor growth in NSG mice monitored by BLI. Arrows indicate three cycles of treatment (N = 5, 5, 6, and 7 for control, ABT199, KPT8602, and combination groups, respectively). BLI data were presented as mean ± standard error of mean. b Bioluminescent images of tumor-bearing mice following drug treatments. Control mice were imaged 15 days post-treatment. Drug-treated mice were imaged 21 days post-treatments. c Kaplan-Meier survival analysis of tumor-bearing mice (log-rank Mantel-Cox test: P < 0.0001)

