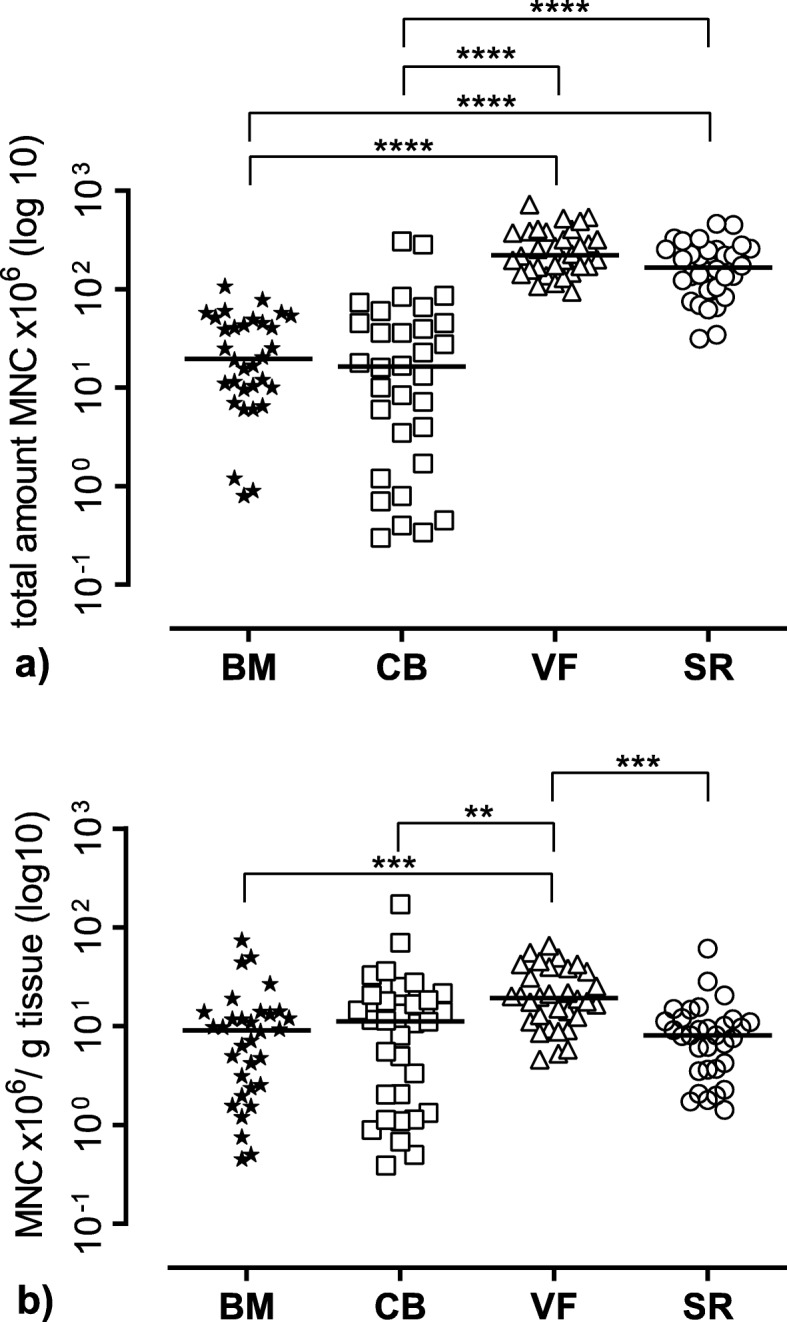
Fig. 2.

Mononuclear cell (MNC) yield of the different tissue sources. a Total number of harvested MNC of the different tissues. b The number of MNC per gram tissue sample. The figure shows the single values of n = 32 patients as symbols with the median as line. BM bone marrow, CB cancellous bone, VF vacuum filter, SF cell saver filtrate reservoir. Significant differences (Kruskal-Wallis test) are indicated with ****p < 0.0001, ***p < 0.001, and **p < 0.01
