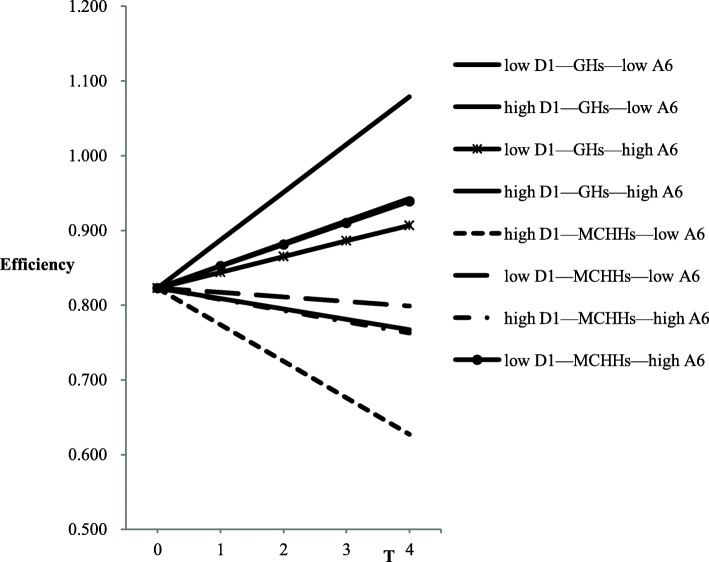
Fig. 2.
Three-level interaction effects. A6 = number of healthcare technicians; D1 = number of healthcare technicians per 1000 people; GH = general hospital; MCHH = maternal and child healthcare hospital. The variables take “mean−1 standard deviation” as the low level and “mean+1 standard deviation” as the high level

