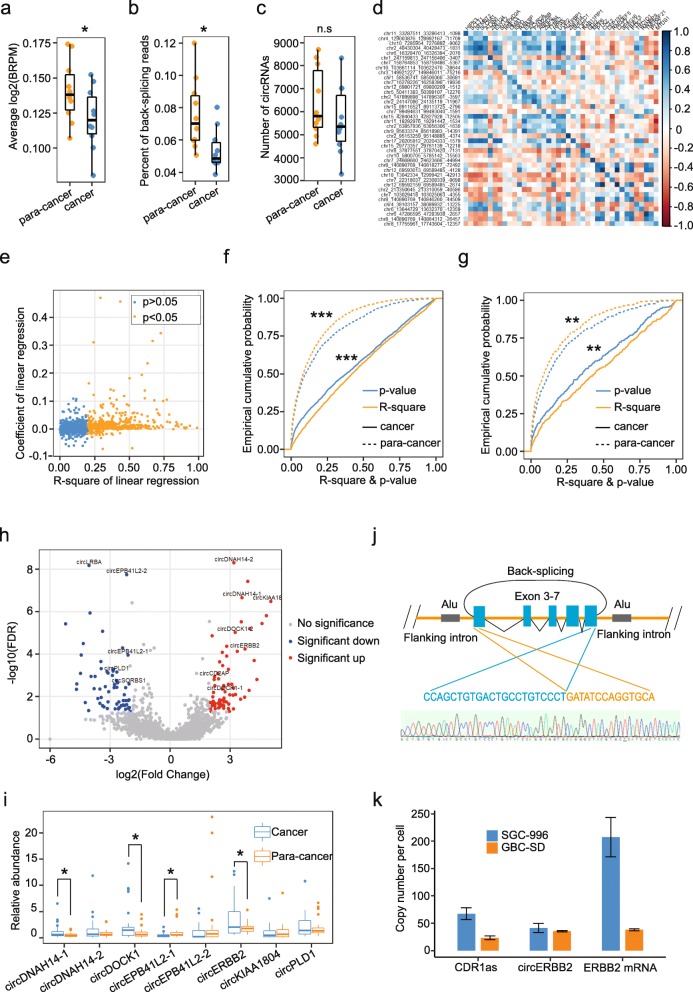
Fig. 1.
Different circRNA expression patterns between GBC and para-cancer tissues, and circERBB2 is significantly increased in GBC tissues. a Average abundance of circRNAs in cancer tissues was significantly lower than para-cancer tissues (n = 10). b Percentage of back-splicing reads in cancer tissues was significantly lower than para-cancer tissues (n = 10). c Number of circRNAs identified in cancer tissues was lower than para-cancer tissues but did not reach significance (n = 10). d Expression of some circRNAs was positively correlated with homogenous mRNA. The color scale indicates the value of Pearson correlation. e Among 2482 highly expressed circRNAs, expression of 483 circRNAs were significantly correlated with homogenous mRNA. And most had positive correlation, only 40 had negative correlation. Coefficient, p-value of coefficient and R-square were calculated with linear regression. f Expression of circRNAs in GBC tissues had significantly increased correlation with homologous mRNAs, compared with para-cancer tissues (n = 2482). g Expression of circRNAs in GBC tissues had significantly increased correlation with homogenous circRNAs, compared with para-cancer tissues (n = 380). h Volcano plot showing circRNAs that changed significantly between cancer and para-cancer tissues. i Expression of the 8 selected circRNAs was determined by qPCR in 29 pairs of GBC and para-cancer tissues (n = 29). j Structure and back-splicing sequence of circERBB2. k Copy number per cell of circERBB2, CDR1as and ERBB2 mRNA. Quantitative data from three independent experiments were presented as mean ± SD (error bars). P-values were determined by paired, two-tailed two sample t-test. FDR value were calculated with BH method. *: p < 0.05; **: p < 0.01; ***: p < 0.001 n.s: not significant

