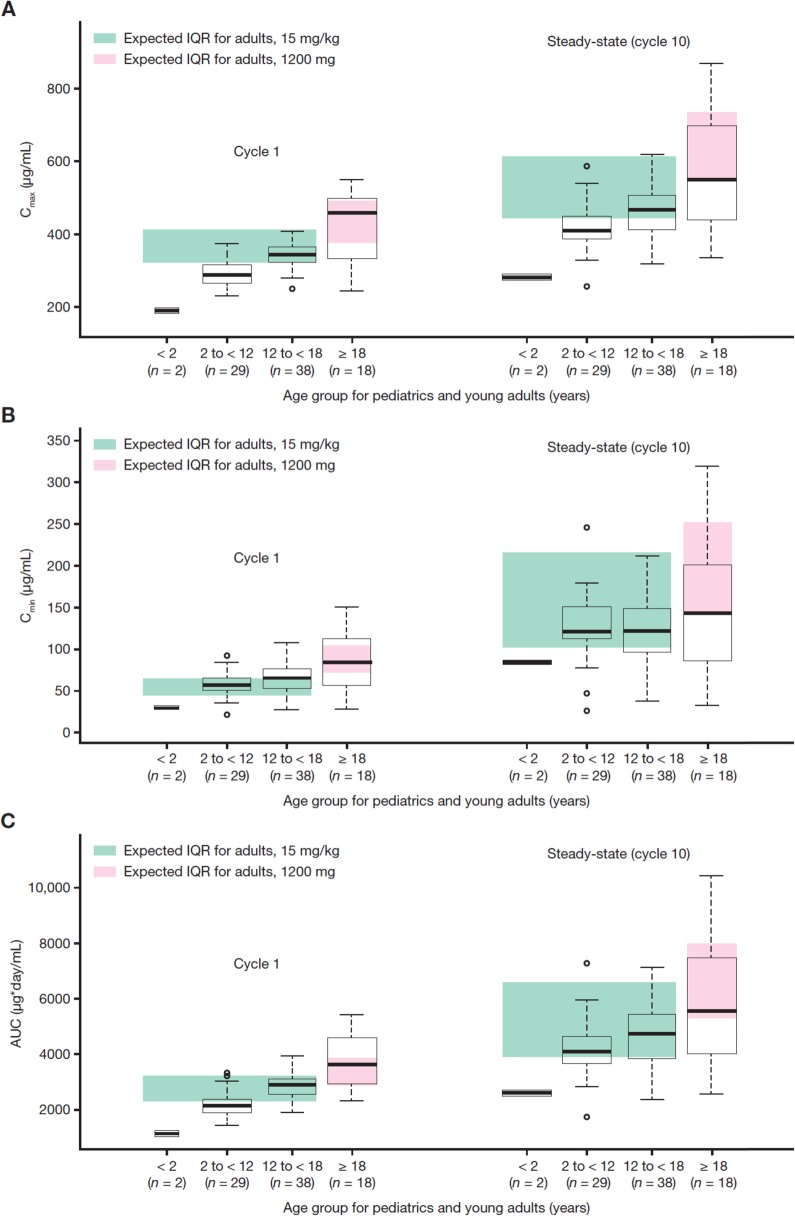
Fig. 2.
Cycle 1 and steady-state (cycle 10) exposure metrics by age group: (a) Cmax, (b) Cmin, and (c) AUC. Expected interquartile range (IQR) from simulated distributions (n = 1000) based on reported geometric means and %CVs. The box-plots indicate the median and IQR (25th to 75th percentile). The whiskers indicate 1.5 times the IQR. Abbreviations: AUC area under the curve, Cmin minimum concentration, Cmax maximum concentration

