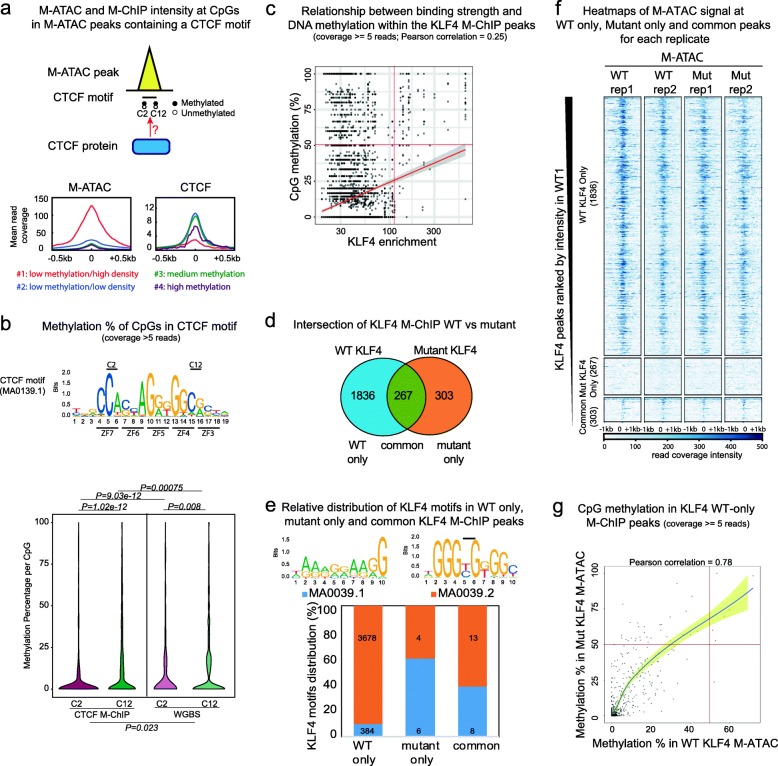
Fig. 4.
M-ChIP enables analysis of DNA methylation binding by CTCF and KLF4. a Top: Schematic illustration representing an ATAC-seq peak with a CTCF motif and CTCF occupancy dependent on C2 and C12 methylation. Bottom: average profiles of M-ATAC (left) and CTCF M-ChIP (right) intensity at CpGs in a CTCF motif within M-ATAC peaks for the four groups of CpGs (group #1: 288 CpGs, group #2: 17133 CpGs, group #3 CpGs: 758, group #4: 25 CpGs). b top: CTCF motif from JASPAR database (MA0139.1). The 2 key CpG positions (C2 and C12) are indicated. Bottom: violin plots of methylation percentage from CTCF M-ChIP and WGBS, at C2 and C12 positions in the CTCF motif (MA0139.1). ***P = 1.02e−12 for C2 CTCF M-ChIP versus C12 CTCF M-ChIP (Wilcoxon test), **P = 0.008 for C2 WGBS versus C12 WGBS (Wilcoxon test), ***P = 9e−12 for C2 CTCF M-ChIP versus C2 WGBS (Wilcoxon test, paired), ***P = 0.00075 for C12 CTCF M-ChIP versus C12 WGBS (Wilcoxon test, paired), *P = 0.023 for CTCF M-ChIP versus WGBS (logistic regression model). c Scatter plot showing the relationship between binding strength and CpG methylation within the KLF4 M-ChIP peaks (Pearson correlation = 0.25; bottom left corner: 5138 CpGs, top left corner: 578 CpGs, top right corner: 104 CpGs, bottom right corner: 60 CpGs). d Venn diagram showing the overlap between WT and mutant KLF4 M-ChIP peaks. e Top: Illustration of KLF4 motifs from the Jaspar database (MA0039.1 and MA0039.2). The black bar represents the potential CpGs present in the MA0039.2 motif. Bottom: histogram showing the relative distribution of KLF4 motifs in WT, mutant and common KLF4 M-ChIP peaks using FIMO from the MEME suite. Absolute numbers of each motif are indicated. f Heatmap showing M-ATAC signal intensity at KLF4 M-ChIP peaks that are specific to WT (1836 peaks), mutant (267 peaks), or common between both conditions (303 peaks). g Average cytosine methylation from M-ATAC in WT versus mutant KLF4 expressing cells in WT specific KLF4 M-ChIP peaks (Pearson correlation = 0.78, p value < 2.2e−16)

