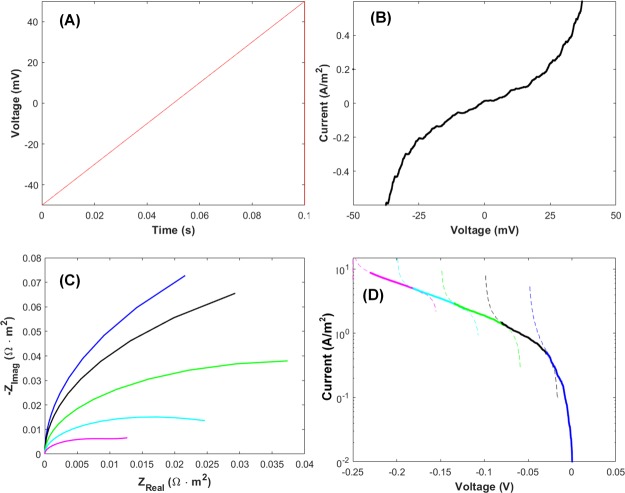
Figure 4.
(A) Liner sweep potential applied and (B) its voltammogram obtained by our approach. (C) Nyquist plots of electrochemical impedance with dc biases (overpotential) of 0 mV (blue), −50 mV (black), −100 mV (green), −150 mV (cyan), and −200 mV (magenta). k0 = 1 × 10⁻⁶ m/s, D = 1 × 10⁻¹⁰ m2/s, COx = CRed = 1 mol/m3. (D) Tafel plots converted from the voltammograms obtained using the impedance data in (C). Colors of the plots are matched to those of the curves in (C) by the dc biases.

