
Figure 2.
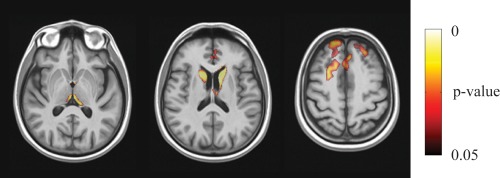
Voxel‐wise corrected p‐value maps (threshold‐free cluster enhancement, TFCE), testing the null hypothesis of zero differences in WR between in PD patients and control subjects. Highlighted clusters indicate significantly (p < 0.05) more pronounced mean atrophy in PD patients when compared to control subjects (i.e., WR in PD patients significantly lower than WR in control subjects). All maps are overlayed on population‐specific template. [Color figure can be viewed in the online issue, which is available at http://wileyonlinelibrary.com.]