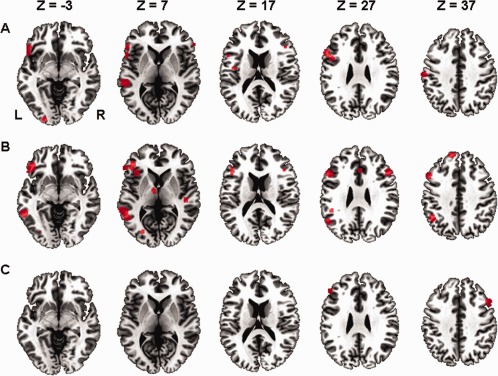
Figure 1.

Results of the ALE meta‐analysis showing significant clusters (P < 0.05, FDR‐corrected for multiple comparisons, cluster size 200 mm3). A: ALE clusters for the contrast of metaphor processing versus low‐level baseline. B: ALE clusters for the contrast of metaphor processing versus literal language processing. C: ALE clusters for the contrast between different types of metaphors. L = left, R = right. [Color figure can be viewed in the online issue, which is available at http://wileyonlinelibrary.com.]
