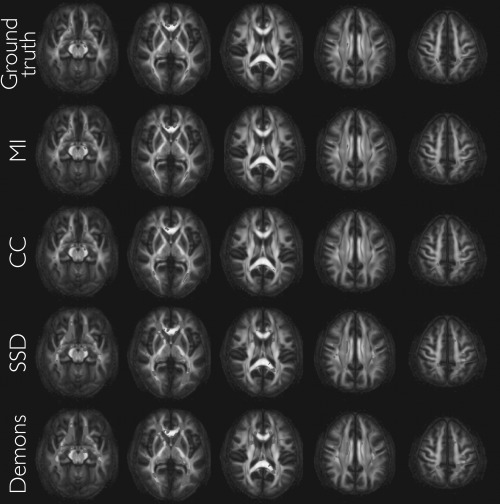
Figure 4.

Top row: Axial slices of the DTI atlas‐derived FA map showing the ground truth significant differences (P ≤ 0.05, smoothing = 4 mm FWHM, uncorrected for multiple comparisons) between control (male) and experimental (female) groups. Rows 2–4: Same axial slices showing varying changes in significant regions following ANTs registration using different similarity metrics. The key point is that there is no anatomical misalignment between the groups before the registration algorithm is run. Although detection power “improves”, (particularly with the SSD and Demons metrics) this is not due to improved anatomical alignment but rather due to local effects related to circularity bias induced by the relationship between the test statistic and the similarity metric. [Color figure can be viewed in the online issue, which is available at http://wileyonlinelibrary.com.]
