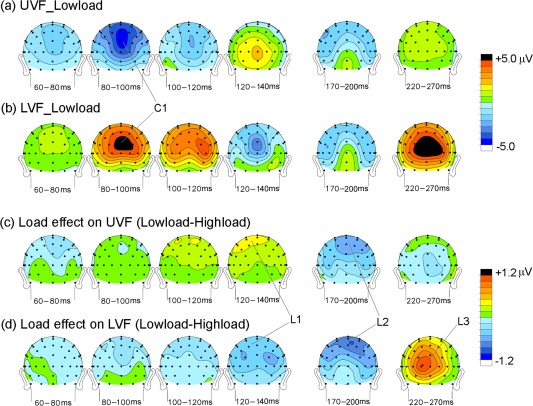
Figure 3.

Voltage topographical maps of the grand averaged ERPs to the peripheral stimuli. (a) Maps of components in original waveforms elicited by UVF stimuli in the low‐load condition; (b) Same as (a) for LVF stimuli in the low‐load condition; (c) Maps of components in low‐load minus high‐load difference waves for UVF stimuli; (d) Same as (c) for LVF stimuli. [Color figure can be viewed in the online issue, which is available at http://wileyonlinelibrary.com.]
