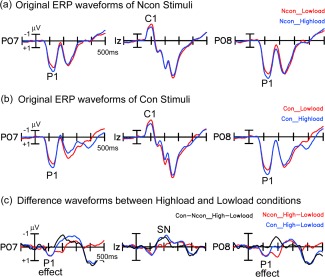
Figure 5.

Grand averaged ERP waveforms elicited by the central stimuli. For both the Con and Ncon stimuli, the P1 amplitude (starting at 70 ms) was significantly larger in the high‐load than the low‐load condition. The difference in load effect between Con and Ncon stimuli did not reach significance until 140 ms, at which time a feature‐based Selective Negativity (SN) effect was elicited. [Color figure can be viewed in the online issue, which is available at http://wileyonlinelibrary.com.]
