
Figure 7.
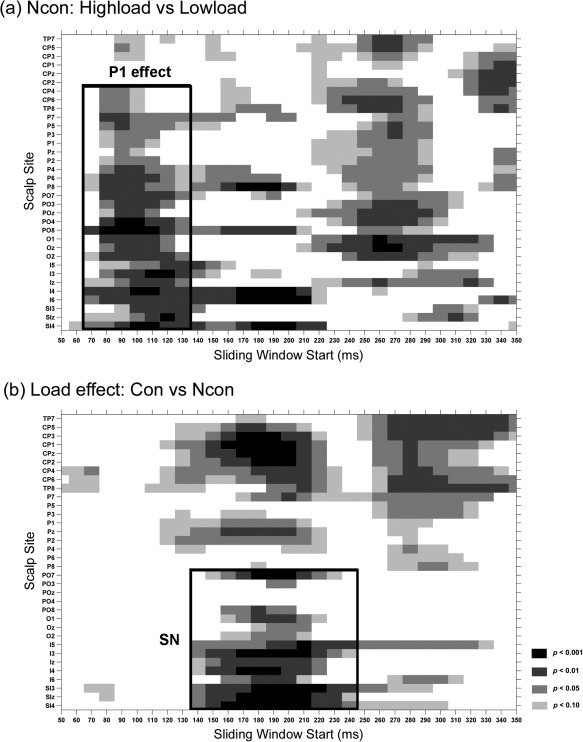
Statistical significance of ERP comparisons for central stimuli. Pair‐wise t‐tests were carried out with a sliding time window of 20 ms and steps of 10 ms at each posterior scalp site. (a) Comparison between the high‐load and low‐load conditions of the Ncon stimuli; (b) comparison of the load effect between the Con and Ncon stimuli.